
|

|

|

|
Figure 457. Curve EQ module.A. Clipping LED B. Curve EQ enable/disable C. Graph D. Band enable/disable (Low, Low-Mid, Mid-High, High)

, Low-Mid
, Mid-High
and High
bands. Enabling a band allows it to be processed with equalization. The knobs and graph curves are color-coded per band:
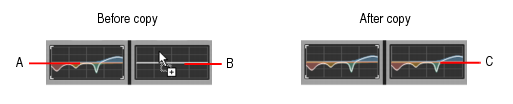
Figure 458. Curve EQ graph.This command is undoable, so you can quickly and easily revert to a track/bus’ previous EQ settings.A. Hold down the CTRL key and left-click in the source EQ plot B. While still holding down the CTRL key and left mouse button, drag the mouse cursor to the target EQ plot and release the mouse button C. The source EQ plot is copied to the target EQ plot


Tip - Searching Documentation
Tip: To search for a specific topic, type your search query in the Search Cakewalk.com field at the top right of this page.
When the search results appear, click which product's documentation you would like to search to filter the search results further.
Note - Using Offline Help
Note: If you prefer to always use offline Help, go to Edit > Preferences > File > Advanced in your Cakewalk software and select Always Use Offline Help.
If you are not connected to the internet, your Cakewalk software will default to showing offline help until an internet connection becomes available.