
|

|

|

|
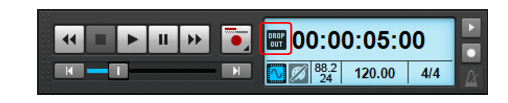
SONAR allows you to set the number of queue buffers in Edit > Preferences > Audio - Driver Settings. A higher number of queue buffers will take longer to fill, and therefore cause an increase in latency. A lower number of queue buffers decreases latency, but may cause “dropouts.” The default setting is 2. For more information, see Mixing latency, and Dropouts and other audio problems.Figure 524. The Transport module.The Dropout Indicatorappears whenever your project requires more resources than your CPU, main memory, and disk can supply. For details, see Dropouts and other audio problems.
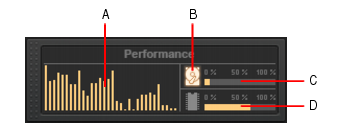
Figure 525. The Performance module.

. Measures how much of the available time SONAR is using to perform input/output functions on your hard disk. The size of your setup’s I/O buffer size (listed under File System in Edit > Preferences > Audio - Sync and Caching) determines how much time is allowed to perform disk operations and maintain uninterrupted playback. When SONAR performs disk operations, the Disk Activity indicator changes color from yellow to red to indicate the time SONAR is taking to complete each cycle of disk input/output. A red icon indicates very high data activity.
Tip - Searching Documentation
Tip: To search for a specific topic, type your search query in the Search Cakewalk.com field at the top right of this page.
When the search results appear, click which product's documentation you would like to search to filter the search results further.
Note - Using Offline Help
Note: If you prefer to always use offline Help, go to Edit > Preferences > File > Advanced in your Cakewalk software and select Always Use Offline Help.
If you are not connected to the internet, your Cakewalk software will default to showing offline help until an internet connection becomes available.